Three signals are worth paging on in a production LLM application, and most teams page on the wrong two. This issue lays out which signals belong on the dashboard, which belong on the pager, the structured-logging schema that makes both possible, and the shadow evaluation pipeline that catches the slow drift the live signals will miss.
Traditional observability practice grew up around services that fail loudly. A 5xx response, a timeout, or a queue depth that climbs without bound is unambiguous evidence that something has gone wrong. LLM applications, by contrast, fail quietly. The HTTP request succeeds, latency remains within budget, the bill at daily granularity looks normal, and the response is nevertheless wrong, refused, or hallucinated. The status page is green; customers are filing tickets. Closing this gap requires a different set of signals, and it is the subject of this issue.
Why traditional observability misses LLM failures
Three structural reasons explain why a traditional observability stack does not catch the failure modes that matter most for LLM applications.
The first reason is that the failures themselves return HTTP 200 OK. When the model declines to answer with a polite refusal, when it answers confidently with a fabricated fact, when the retriever returns the wrong document and the response is groundless, or when an agent completes its chain without performing the requested action, the application returns a successful response code in every case. None of these failures surface as exceptions, none of them move the 5xx graph, and none are visible to a simple health check.
The second reason is that p99 latency in LLM applications is dominated by sources of variance the operator does not control. Provider-side queueing, autoscaling cold starts, and naturally longer output lengths can each move p99 by hundreds of milliseconds without indicating that anything is wrong. As a result, an alert tied to p99 latency tends either to fire constantly, prompting the team to raise the threshold until the alert is effectively disabled, or to be silenced at the outset.
The third reason is that total token cost is a lagging indicator at the granularity most teams measure it. A daily aggregate, reviewed on the morning after the fact, will surface a problem that began the previous afternoon. By the time the dashboard reflects the issue, the bill has often already doubled.
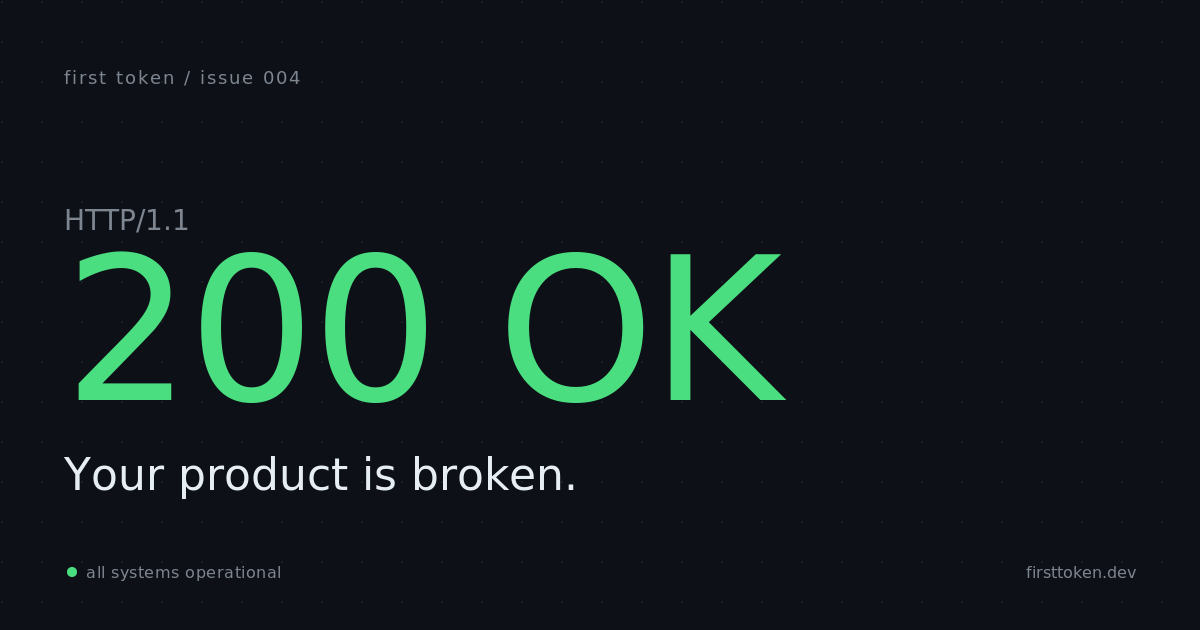
The combined effect of these three gaps is observability that confirms the network is up while the product is broken. The previous issue described evaluations that catch regressions before merge; this issue addresses the production signals that catch regressions after merge, while traffic is live.
The two signals most teams default to
Most teams already monitor two signals by default: HTTP error rate and p99 latency. Both belong on the operations dashboard. Neither, however, is the right primary input to a pager rule in an LLM application, for the reasons that follow.
HTTP error rate was the canonical health signal for traditional services, where a 5xx response unambiguously indicated a failure. In an LLM application, the HTTP layer reflects only the health of the gateway and the model provider. A response that politely refuses to answer the user's question is still a 200 OK, as is a response that cites a paper that does not exist. Treating HTTP error rate as the primary health signal therefore creates a false sense of system health.
P99 of total latency is informative for services where the legitimate latency range is narrow. For LLM applications, the legitimate range is wide enough that the metric is rarely actionable as an alert. The median of time-to-first-token (the latency from request to the first output token) is a more useful signal for provider health, because it isolates the part of the request most sensitive to upstream queueing. Total p99 latency, by contrast, conflates provider variance with legitimate variation in output length.
Neither signal is wrong to capture; both belong on the dashboard. The issue is that both are insufficient as the primary input to an alert, because the failures they detect are not the failures customers report.
The three signals that warrant paging
The signals below correspond more reliably to the failure modes that affect customers, presented in rough order of blast radius (smallest first). The thresholds attached to each signal are starting points for tuning against real production data, not measured optima. The structural shape of each rule (which signal it monitors, which time window it considers, and which comparison it applies) generalises across products; the specific threshold value must be tuned within the environment.
Signal 1: structured-output validation failure rate. If the application contracts on a JSON schema, a citation format, or a tool-call shape, every response should be validated against that contract at runtime. The rate at which validation fails is a leading indicator that a prompt change, a model upgrade, or a shift in upstream content has broken the contract. A reasonable starting threshold is to page when the failure rate exceeds one percent over a five-minute window. The appropriate floor depends on the product: one percent is a sensible starting point for a general-purpose application, while higher-stakes domains such as medical, legal, or financial software should choose a stricter threshold. Any rate above the chosen floor warrants immediate investigation, because schema failures are the fastest failure mode to detect and typically the fastest to remediate.
Signal 2: refusal and fallback rate. This signal tracks the fraction of responses that hit the application's fallback path. Examples include explicit refusals from the model, abstentions issued when the retriever returns nothing sufficiently relevant, and deterministic "I do not have enough information" responses returned by the application itself. Every application has a baseline rate; the production-relevant event is a sudden departure from that baseline. A practical alert rule is to page when the rate deviates by three standard deviations from the trailing twenty-four-hour baseline over a fifteen-minute window, or when it doubles, whichever condition triggers first. A sudden doubling of the refusal rate almost always indicates that something upstream has changed, whether a prompt template, an embedding model, or the foundation model itself.
Signal 3: cost per successful request, trending upward. Aggregate spend is a lagging indicator. Cost per successful request, by contrast, is a leading one. A prompt change that adds two thousand tokens to every call, a retry loop that has started firing under a partial outage, or a chain that has quietly grown an additional LLM hop will all become visible in this signal within minutes. A reasonable starting rule is to page on a thirty-percent deviation from the rolling one-hour baseline, sustained for at least ten minutes. The sustained-duration requirement filters out transient spikes that do not warrant an immediate response.

The diagram above illustrates the production path. Each response is evaluated against the three checks, and any of the three may trigger a page. Stable readings flow through to the structured log, where they remain available for analysis. The alert rules consume the log store rather than instrumenting the application path directly, which keeps the alerting layer tolerant of latency and avoids introducing new failure modes into the production request flow.
The logging schema
To make the three alerts above possible, the application must emit a stable structured event for each inbound request. The schema below lists the fields that have proven necessary in practice. Each field is required unless explicitly marked optional, because any field omitted at design time tends to be the field requested during incident triage.
{
  "request_id": "uuid",
  "tenant_id": "string",
  "user_id_hash": "sha256 prefix",
  "ts": "iso-8601",
  "route": "endpoint name",
  "model": {"name": "claude-haiku-4-5", "version": "20251001"},
  "prompt_template": {"id": "rag_qa", "version": "v17"},
  "tokens": {"in": 1840, "out": 312},
  "cost_usd": 0.00214,
  "latency_ms": {"total": 1240, "ttft": 280, "tool_calls": 410},
  "retrieval": {"top_k": 8, "doc_ids": ["..."], "scores": [0.81, 0.77]},
  "tool_calls": [{"name": "search", "ok": true, "latency_ms": 180}],
  "response_class": "success | refusal | schema_fail | tool_fail | fallback",
  "schema_valid": true,
  "eval_score": null
}
Several design choices in this schema deserve explanation. Prompt and response bodies should be written to a separate, access-controlled store with a shorter retention window, while the hot log retains only their hashes and lengths. This separation is sufficient for the queries the hot log needs to support, and it limits the exposure of user-generated content within the broader observability stack. The user identifier should be hashed before storage, so that the log store does not become a source of primary user identifiers in the event of an access breach. The eval_score field is null on the production hot path and is populated only for the small fraction of requests that the shadow evaluation pipeline grades. The structure as a whole is intentionally shallow enough to query efficiently, detailed enough to support post-incident reconstruction, and stable enough that dashboards built on it remain functional across product changes.
The shadow evaluation pipeline
The three live alerts catch step-changes in system behaviour, but they are not designed to catch slower failure modes. When response quality decays by a percent or so each week, no live alert will trigger, and customers will perceive the degradation long before any aggregate metric does. The shadow evaluation pipeline is designed to surface this kind of drift before it reaches that point.
The pipeline operates as follows. A small fraction of production traffic, typically between one and five percent, is sampled asynchronously into a grading pipeline that runs the same three-layer evaluator described in Issue 3, namely deterministic checks, reference comparisons, and an LLM-as-judge layer. The resulting score is written back to the corresponding log event. Operations teams track the trailing seven-day average of that score and alert on a downward trend rather than on individual results.
Two properties of the pipeline are worth emphasising. First, the shadow path never blocks the production request: sampling and grading are entirely asynchronous, so the addition of the pipeline cannot introduce latency or new failure modes into the customer path. Second, a drift signal is treated as a warning that warrants investigation, not as an automatic rollback trigger. The reason is that drift signals tend to be slow-moving, and a hasty rollback in response to noise in the trailing average risks introducing instability without correcting the underlying issue.

The diagram shows the shadow evaluation flow. Sampled responses are graded by the three-layer evaluator and their scores stored against the original request identifier. A downward trend in the trailing average is surfaced as a warning, allowing engineers to investigate before customers report the issue.
Common mistakes
Four mistakes recur in production observability implementations for LLM applications. Each is worth naming directly, because each undermines the value of the rest of the stack.
The first mistake is sampling the structured log itself. Sampling is attractive as a cost-control measure, but it is the wrong place to apply it. Failure analysis is dominated by rare events, and any sampling strategy will preferentially discard the events most useful for post-incident analysis. The recommended pattern is to retain one structured event per request on the hot log, and to apply sampling only to the expensive payload fields, namely the full prompt and response bodies, which are written to a separate, access-controlled store.
The second mistake is omitting per-tenant breakdowns. Aggregate metrics conceal regressions affecting a single tenant and obscure noisy-neighbour behaviour, in which one tenant's traffic shape degrades the experience of others. Every signal described above should be sliceable by tenant_id and by prompt template version, because the first question in any production investigation is which slice is affected. A dashboard that cannot answer this question is one that engineers will quickly stop consulting.
The third mistake is configuring a single pager rule per metric. A pager rule that fires several times per hour will be muted within the week, regardless of how important the underlying metric is. Multi-window multi-burn-rate rules address this by pairing a fast window (typically around five minutes) with a slow window (around one hour), each gating on a different error-budget burn rate. The pager fires only when both windows trigger, which suppresses transient spikes while still surfacing sustained degradation promptly. The Google SRE Workbook entry cited below documents the standard burn-rate pairings in detail.
The fourth mistake is the absence of a request replay capability. The fastest tool for debugging a regression is the ability to replay a specific request end-to-end, against the current prompt and model, using the original retrieval results, given only the request_id. Without this capability, on-call engineers must reconstruct the failure from log entries, which is slow under ordinary conditions and substantially slower under incident pressure.
Summary
LLM applications fail with HTTP 200 OK, and the traditional triage signals (5xx rate, total p99 latency, and daily aggregate spend) miss every failure mode that customers consistently report. Three alternative signals are better suited as primary alert inputs: structured-output validation failure rate, refusal-and-fallback rate, and cost per successful request, sustained. These signals depend on a stable structured log emitted per request, and they are usefully complemented by a shadow evaluation pipeline that samples production traffic and surfaces gradual drift. Other metrics remain valuable for dashboards and post-hoc analysis, but they do not belong on the pager.
Production checklist
The following checklist consolidates the recommendations into actionable steps.
Implement structured-output validation in the response path and emit a
schema_validboolean per response, sliced by prompt template version.Classify every response into one of
success,refusal,schema_fail,tool_fail, orfallback, and track the resulting distribution as a first-class metric.Compute cost per successful request as a rolling one-hour series, sliced by tenant and template, and expose the series on the operations dashboard.
Define pager rules from the starting thresholds above: schema-validation failure above one percent over five minutes; refusal three standard deviations from the baseline over fifteen minutes; cost per request thirty percent above baseline over ten minutes. Tune each threshold to local production data over time.
Retain one structured log event per request, redact or hash all user-identifying fields, and route full prompt and response bodies to a separate access-controlled store with a shorter retention window.
Sample between one and five percent of production traffic into the shadow evaluation pipeline introduced in Issue 3. Score asynchronously, and alert on trailing-trend drift rather than on individual results.
Implement a request replay command that, given a
request_id, re-runs the same input end-to-end and produces a diff against the original output.Review pager rules at a defined cadence (monthly is reasonable for early-stage products), because a threshold appropriate today may become a source of alert fatigue six months later as the baseline shifts.
Further reading
The following references provide deeper background on the practices summarised above.
The OpenTelemetry semantic conventions for generative AI (opentelemetry.io/docs/specs/semconv/gen-ai) define standardised attribute names and signal shapes for LLM telemetry.
The Google SRE Workbook chapter on alerting against service-level objectives (sre.google/workbook/alerting-on-slos) documents the multi-window multi-burn-rate technique and its recommended pairings.
Honeycomb's engineering blog (honeycomb.io/blog) maintains a current set of practical posts on observability for LLM-based applications.
Eugene Yan's writing on evaluating LLM-as-judge patterns (eugeneyan.com/writing/llm-evaluators) is a useful complement to the shadow evaluation discussion above.